Research notes are fog until they know your mandate
Broker research, expert views, model signals: a portfolio manager receives them all day. Each one looks at a stock, on its own. Your positions, your weights, your turnover budget and your tracking error target stay out of the picture.
Datapred starts from that complete view, and from the question every benchmarked mandate asks each week: which stocks to hold, and at what weight.
More market data than a team can read
A universe of 100 or 200 stocks moves every day, and so do the drivers behind it. A team of portfolio managers reads a fraction of it.
A long way from a signal to a trade list
A ranked list of expected winners and losers still has to become post-trade weights and a list of moves. And that portfolio has to pass every constraint before anyone trades.
Construction rules change before anyone has measured them
Number of lines, turnover budget, sector caps, tracking error target: each rule shapes the portfolio. Tightening one is usually decided before anyone has measured what it does to performance and risk.
Your recommendation has to hold up in committee
Investment committee, risk, compliance and clients will ask how you built your view and why it moves. Every Datapred output comes with its drivers, so yours is always explainable.
SOLUTION
How the Datapred Portfolio Manager works
See every trend through your mandate and turn it into performance.
Two steps, every week. Datapred ranks and sizes. You decide.
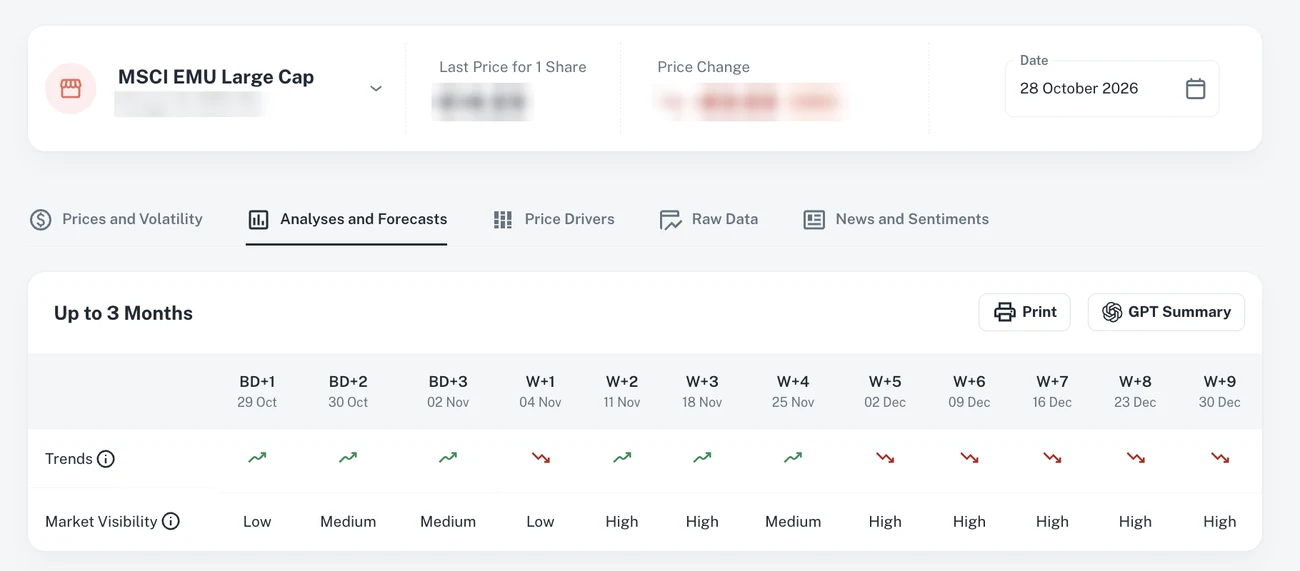
Markets module, Analyses and Forecasts, 28 October 2026. Stock name and price masked.
Step 2 · Portfolio optimisation
Illustrative data
From trends to target weights, inside your rules
PositionForecast trend0%1%7.5%Move
Stock H0.00at the 7.5% cap
Stock B+1.50new position
Stock A+0.30
Stock C+0.15
Stock M−0.15
Stock V−1.90closed
Current weightTarget weightWeight per position: 1% to 7.5%
38Number of holdings, 40 maximum
2.1%Traded this week, inside a turnover budget of 10% a month
≥ 4.5%Tracking error against your benchmark
Rules of the mandate in production. Other rules are configured on request, for example sector caps and exclusion lists.
Step 3 · You decide
Datapred
Forecasts every stock in your universe
Ranks and sizes, inside your rules
Sends target weights and moves, the largest explained
Datapred executes nothing
You
Review the moves
Keep what you want, drop the rest
Execute with your own tools
YOUR CONSTRAINTS
Your flight simulator
Change a constraint, see what it does to your portfolio, before it costs you
Datapred replays your strategy on your own portfolio and your own history. Tighten the turnover budget, cap a sector, loosen the tracking-error target: you see the impact on performance and risk, adjust as you wish, and only then fly for real.
Pilots train in a simulator before they fly. So should a portfolio.
Replay on your history · Illustrative data
Current rulesWith a sector cap
Illustrative data, not actual results. Two versions of the same rules, replayed on the same 12 months of history. The real replay runs on your universe, your constraints and your benchmark.
VALIDATION
Tested before it runs on your portfolio
Every strategy, and every constraint change, goes through the same 4 steps before we talk about deployment.
01
Configure
Choose the horizon and the parameters of each variant to test.
02
Backtest
Replay each variant on your history, under the same constraints.
03
Compare
Measure performance against your benchmark and assess risk.
04
Confirm
Evaluate the selected variants on data that wasn’t used to select them.
Every position with its target weight, and the buys and sells to reach it from the portfolio’s current weights. In the Excel file.
Attached Excel file · 1 line per position
Illustrative data
Position
Previous weight %
Target weight %
Total change %
Stock B
0.00
1.50
+1.50
Stock A
2.10
2.40
+0.30
Stock C
3.70
3.85
+0.15
Stock D
1.80
1.90
+0.10
Stock E
2.50
2.55
+0.05
Stock V
1.90
0.00
−1.90
Stock M
3.20
3.05
−0.15
Stock W
2.60
2.55
−0.05
+ 31 positions unchanged
The whole portfolio, 40 lines at most. Increases and decreases balance at 2.10 points each: the portfolio stays fully invested.
A summary of the moves, in figures and in words
Turnover and trading cost, the sectors with weight increases and decreases, a short note on the largest moves, and the count of positions opened, closed, increased and reduced. In the body of the email.
Body of the email
Illustrative data
2.9%Total portfolio turnover
2.1%Active turnover
1.2%Passive drift
0.008%Trading cost
Sectors with weight increases: Health Care, Industrials, Financials. Among the largest increases, Stock B and Stock C are up on all 3 periods, with low volatility. The recent trend of Stock A is stable, with medium volatility.
Sectors with weight decreases: Utilities, Energy. Among the largest decreases, Stock V is down on all 3 periods, with low volatility, while Stock M is up, with high volatility.
Summary of moves
Count
Weight change
New positions
1
1.50%
Closed positions
1
1.90%
Increased positions
4
0.60%
Reduced positions
2
0.20%
Same structure as the real weekly email, translated. Every number is fictional.
SECURITY
Security
Datapred SA is certified ISO/IEC 27001:2022 (April 2026). The platform supports two-factor authentication and single sign-on.
WHO IT’S FOR
Who it’s for
CIOs and portfolio managers running benchmarked equity mandates, at an asset manager or a private bank. Family offices with an in-house equity mandate too.
Equity portfolios today. A broader universe is scoped case by case.
How to start
A 30-minute call to go through your universe, benchmark, mandate rules, data and decision process.
Then a paid pilot on your own universe and history: we replay the strategy under your constraints and report performance and risk against your benchmark. You see the numbers on your own mandate before any deployment.