In response to growing energy price instability, numerous industrial companies in Europe have begun exploring the possibilities of energy hedging.
But hedging is a risk management technique... that carries its own risks, and quantifying the potential downside of hedging strategies is crucial.
Value-at-Risk (VaR) is the traditional go-to method for this task, but it comes with notable limitations.
In this article, we'll first recap what VaR is with its pros and cons, then explore alternatives offering an approachable and effective measure of risk.
Value-at-Risk
VaR is a statistical technique used to measure the risk of capital loss over a specific time frame. It provides a worst-case scenario with a certain level of confidence, meaning it quantifies the potential loss over a defined period for a given confidence interval.
The primary upside of VaR is its wide acceptance as the standard risk measurement — nobody ever got fired for using VaR.
The problem is that calculating it, especially dynamically, is quite technical: should you use the historical, the variance-covariance or the Monte Carlo method? how should you backtest your calculations?
In our view, this complexity makes VaR a little overkill for industrial energy buyers, as opposed to full-fledged energy traders.
Two alternative risk measurements
Standard deviation
Standard deviation is a classic and simple way to estimate price risk. At Datapred, we like to compare:
- The standard deviation of the prices you have effectively paid (weighted by the corresponding transaction volumes)...
- ...and the standard deviation of market prices during the same period.
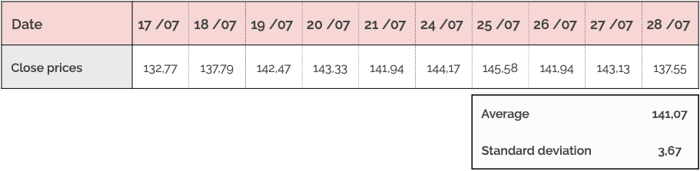
Let's take the example of a German company wishing to hedge 400 MWh of electricity exposure in 2024, using EEX's base calendar 2024 future. The time period selected by this company to do this is between 17 and 28 July 2023.
Over this period, close prices for this EEX product averaged €141.07 euros, with a standard deviation of €3.67:
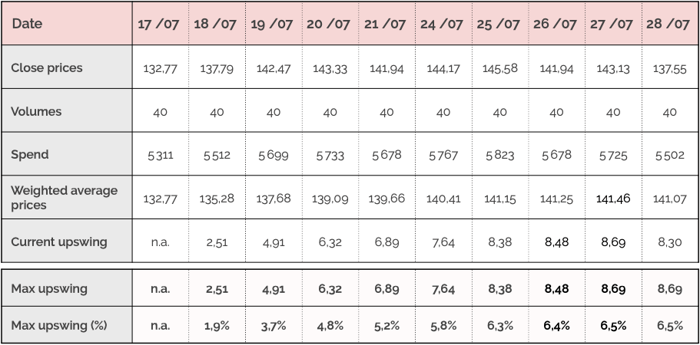
If the company had spread the 400 MWh equally over these 10 days, hedging 40 MWh on each day at the close price of that day (the "monkey strategy"), here is the transaction-weighted standard deviation that would have resulted:
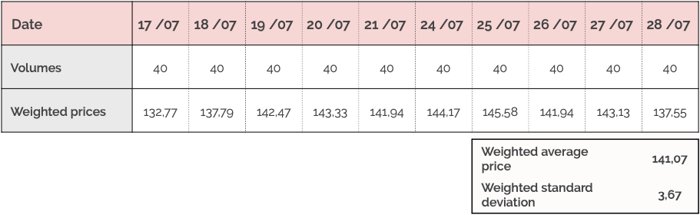
Unsurprisingly since transaction volumes are evenly spread over the period, they are the same as the average and standard deviation for "pure" market prices.
That basic strategy is our benchmark.
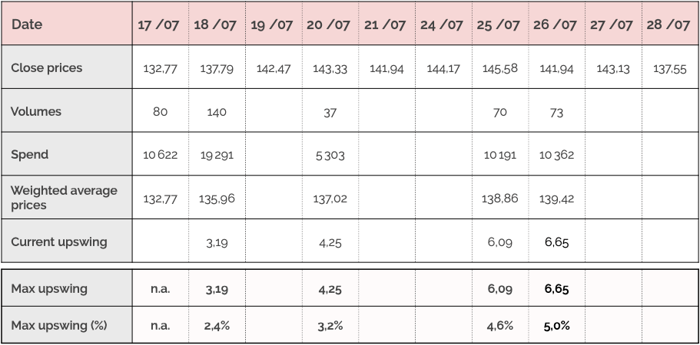
In reality, the company tried to optimize transaction timing a little bit, resulting in the following transaction pattern, weighted average price and weighted standard deviation:
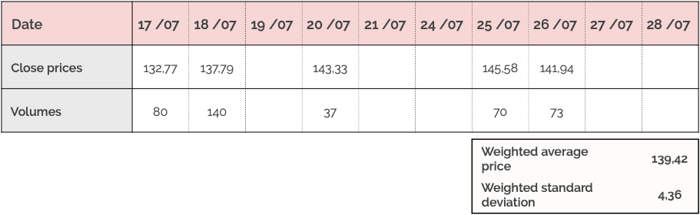
The weighted average price of the optimized strategy is lower than our benchmark (€139.42 to €141.07): if we stopped our analysis here, we would conclude that our energy buyer was successful.
However, comparing the weighted standard deviations of the optimized strategy and the benchmark (€4.36 to €3.67) shows this was achieved by a slight increase in price risk during the period.
This is potentially acceptable — it all depends on the priorities of our German company. But the trade-off should be explicit.
Maximum upswing
A drawback of standard deviation for risk measurement is that it is equally affected by price increases and decreases, while energy buyers are obviously more adverse to upward than downward price movements.
We therefore suggest complementing standard deviation with the "maximum upswing", which is the maximum price increase between two transactions over a given period.
Going back to our example, here is the maximum upswing of the benchmark:
...and here is the maximum upswing of the optimized strategy:
Looking at the maximum upswing thus mitigates the conclusion of our standard deviation analysis: yes, in terms of price standard deviation, the optimized strategy is slightly more risky, but that risk is really a pure volatility risk, not a bigger exposure to price rises.
Reviewing price, standard deviation and upswing thus provides a good understanding of the risk/return profile of an energy hedging strategy, especially when compared to a simple benchmark.
To deepen our understanding of the strategy we are assessing, we could calculate them over specific periods (the first Covid lockdown, the start of the war in Ukraine...), or under stressed price conditions (higher average price or price volatility).
***
Datapred's online app for energy buyers automates most of these calculations. Don't hesitate to click the link below and schedule a demo with one of our experts!
You can also visit this page for additional resources on energy procurement.