Schedule a call
Choose a time to meet. We’ll discuss your goals and analyze your buying reporting.
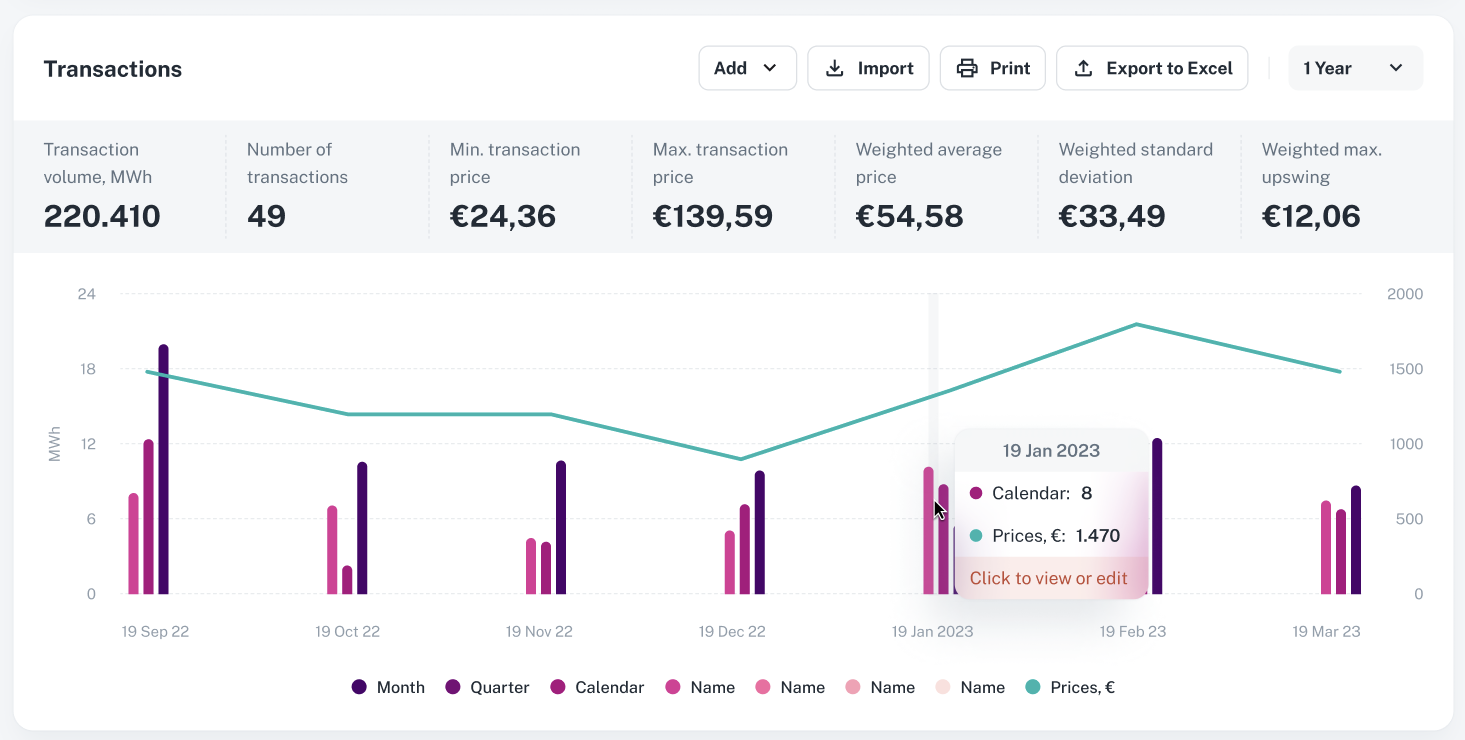
For basic reporting tasks, like keeping a clean record of spot or futures transactions, it is time for buyers to upgrade from Excel, and enjoy the benefits of modern online software: a user-friendly interface, easy sharing with stakeholders, direct access to market prices...
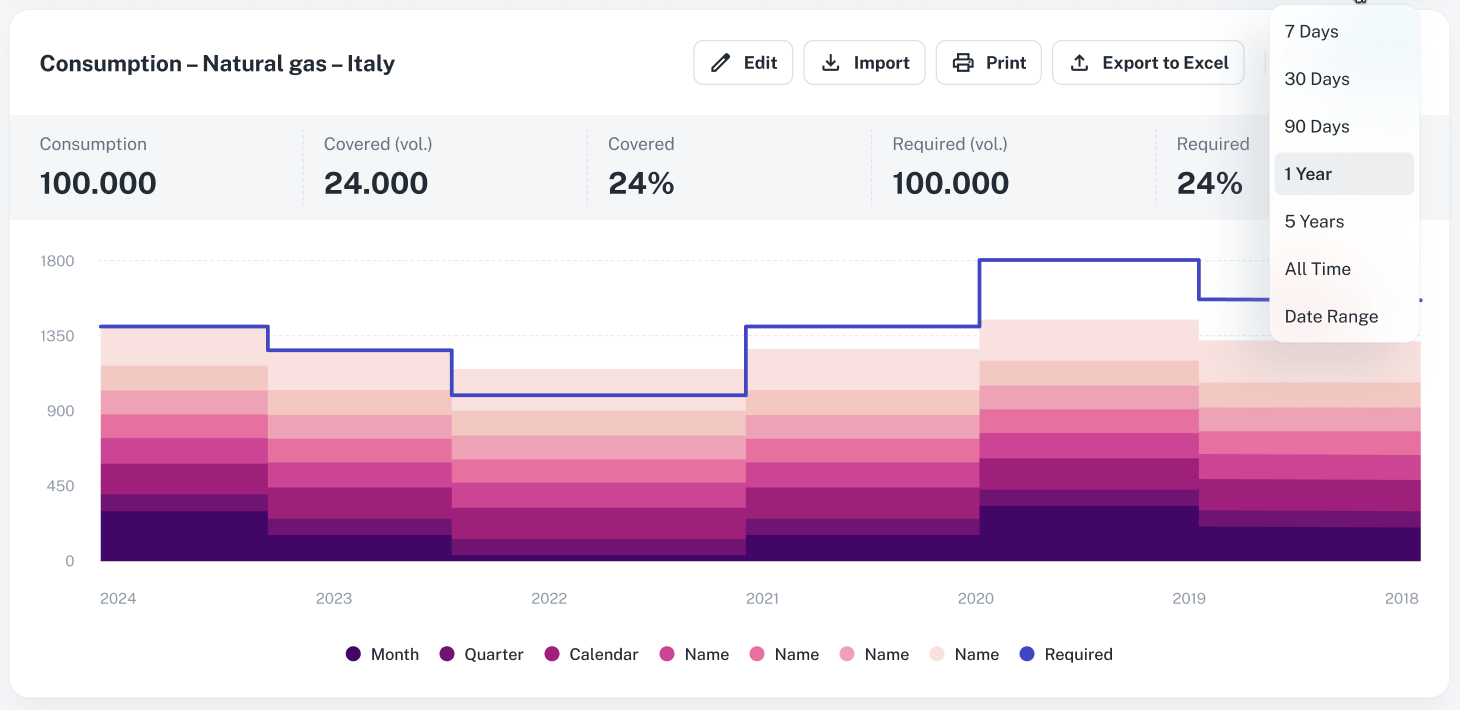
Upload your buyer profile and, based on the energy or raw materials transactions you have also uploaded, Datapred will provide instant visualization of your exposure, and calculate the corresponding coverage ratios.
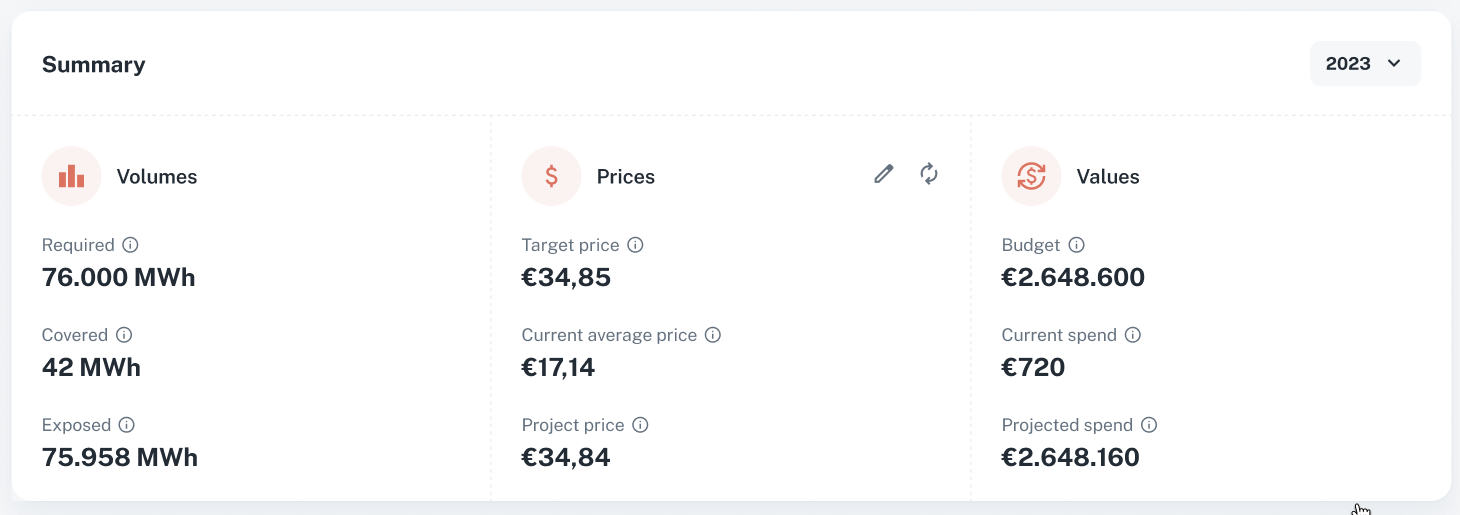
Given your consumption profile and your transactions to date, where are you compared to your target price and budget for the selected period, and where can you expect to land?
The profit and loss calculations on the Reporting page quickly answer these questions.
The calculations are always up to date, thanks to the direct connection of the Reporting module to energy market prices.
We know that to get in, you need the confidence that you will be able to get out.
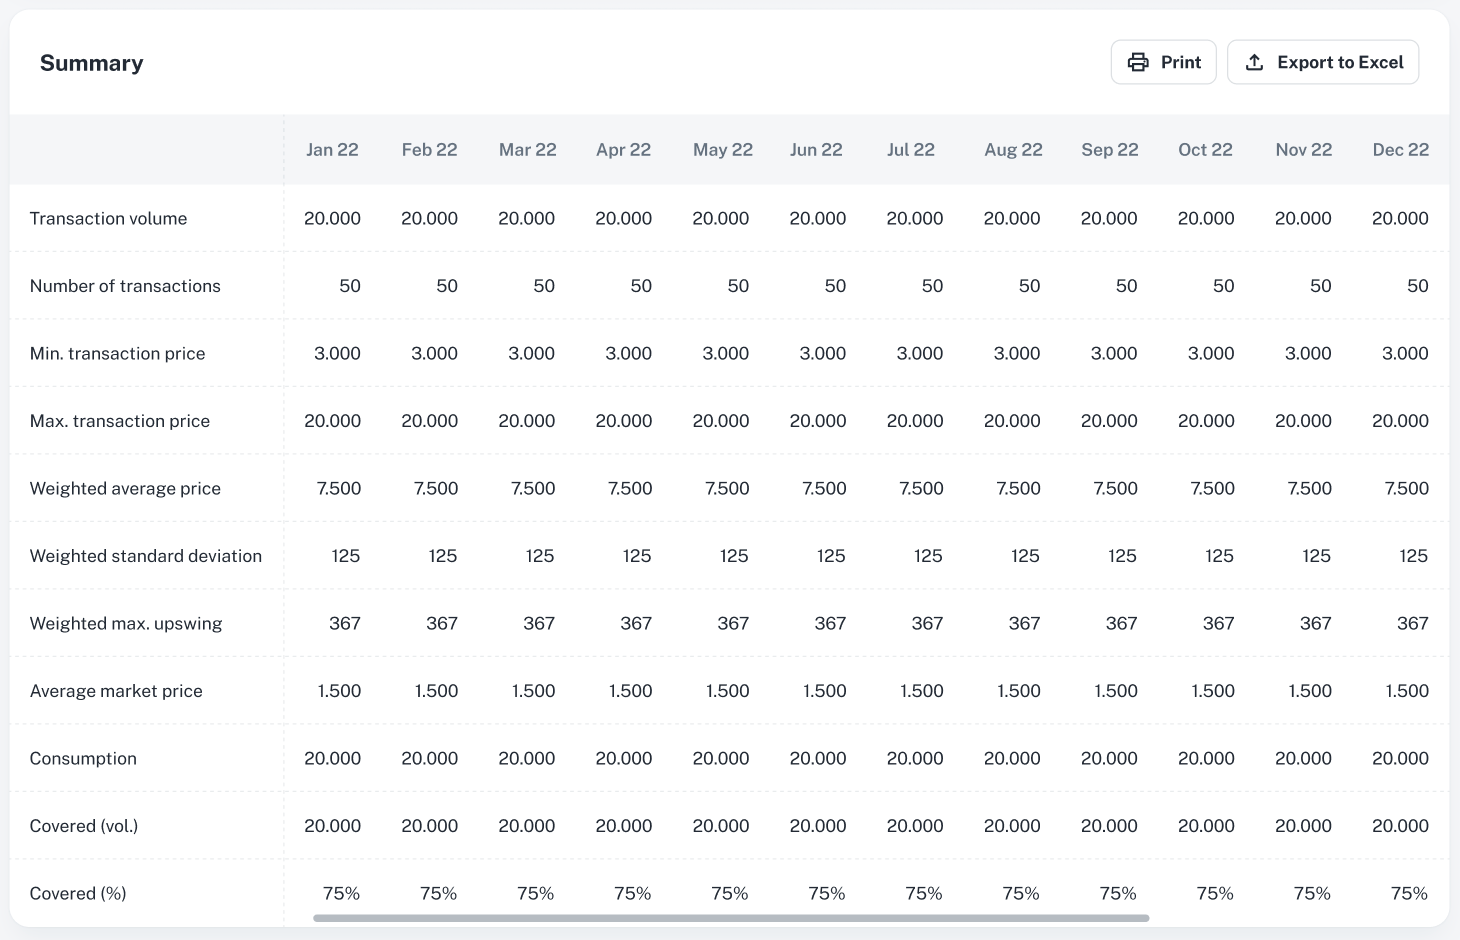
You have the option to download all data from the Reporting page back to Excel whenever you need.
At the bottom of the Reporting page, you can also preview the Excel file layout: a well-organized table displaying consumption and transaction metrics by month.
Very useful when you need to prepare customized presentations and reports.